Q4 2022 Western Washington Economic & Real Estate Update
The following analysis of select counties of the Western Washington real estate market is provided by Windermere Real Estate Chief Economist Matthew Gardner. I hope that this information may assist you with making better-informed real estate decisions. For further information about the housing market in your area, please don’t hesitate to contact me.
Regional Economic Overview
Although the job market in Western Washington continues to grow, the pace has started to slow. The region added over 91,000 new jobs during the past year, but the 12-month growth rate is now below 100,000, a level we have not seen since the start of the post-COVID job recovery. That said, all but three counties have recovered completely from their pandemic job losses and total regional employment is up more than 52,000 jobs. The regional unemployment rate in November was 3.8%, which was marginally above the 3.7% level of a year ago. Many business owners across the country are pondering whether we are likely to enter a recession this year. As a result, it’s very possible that they will start to slow their expansion in anticipation of an economic contraction.
Western Washington Home Sales
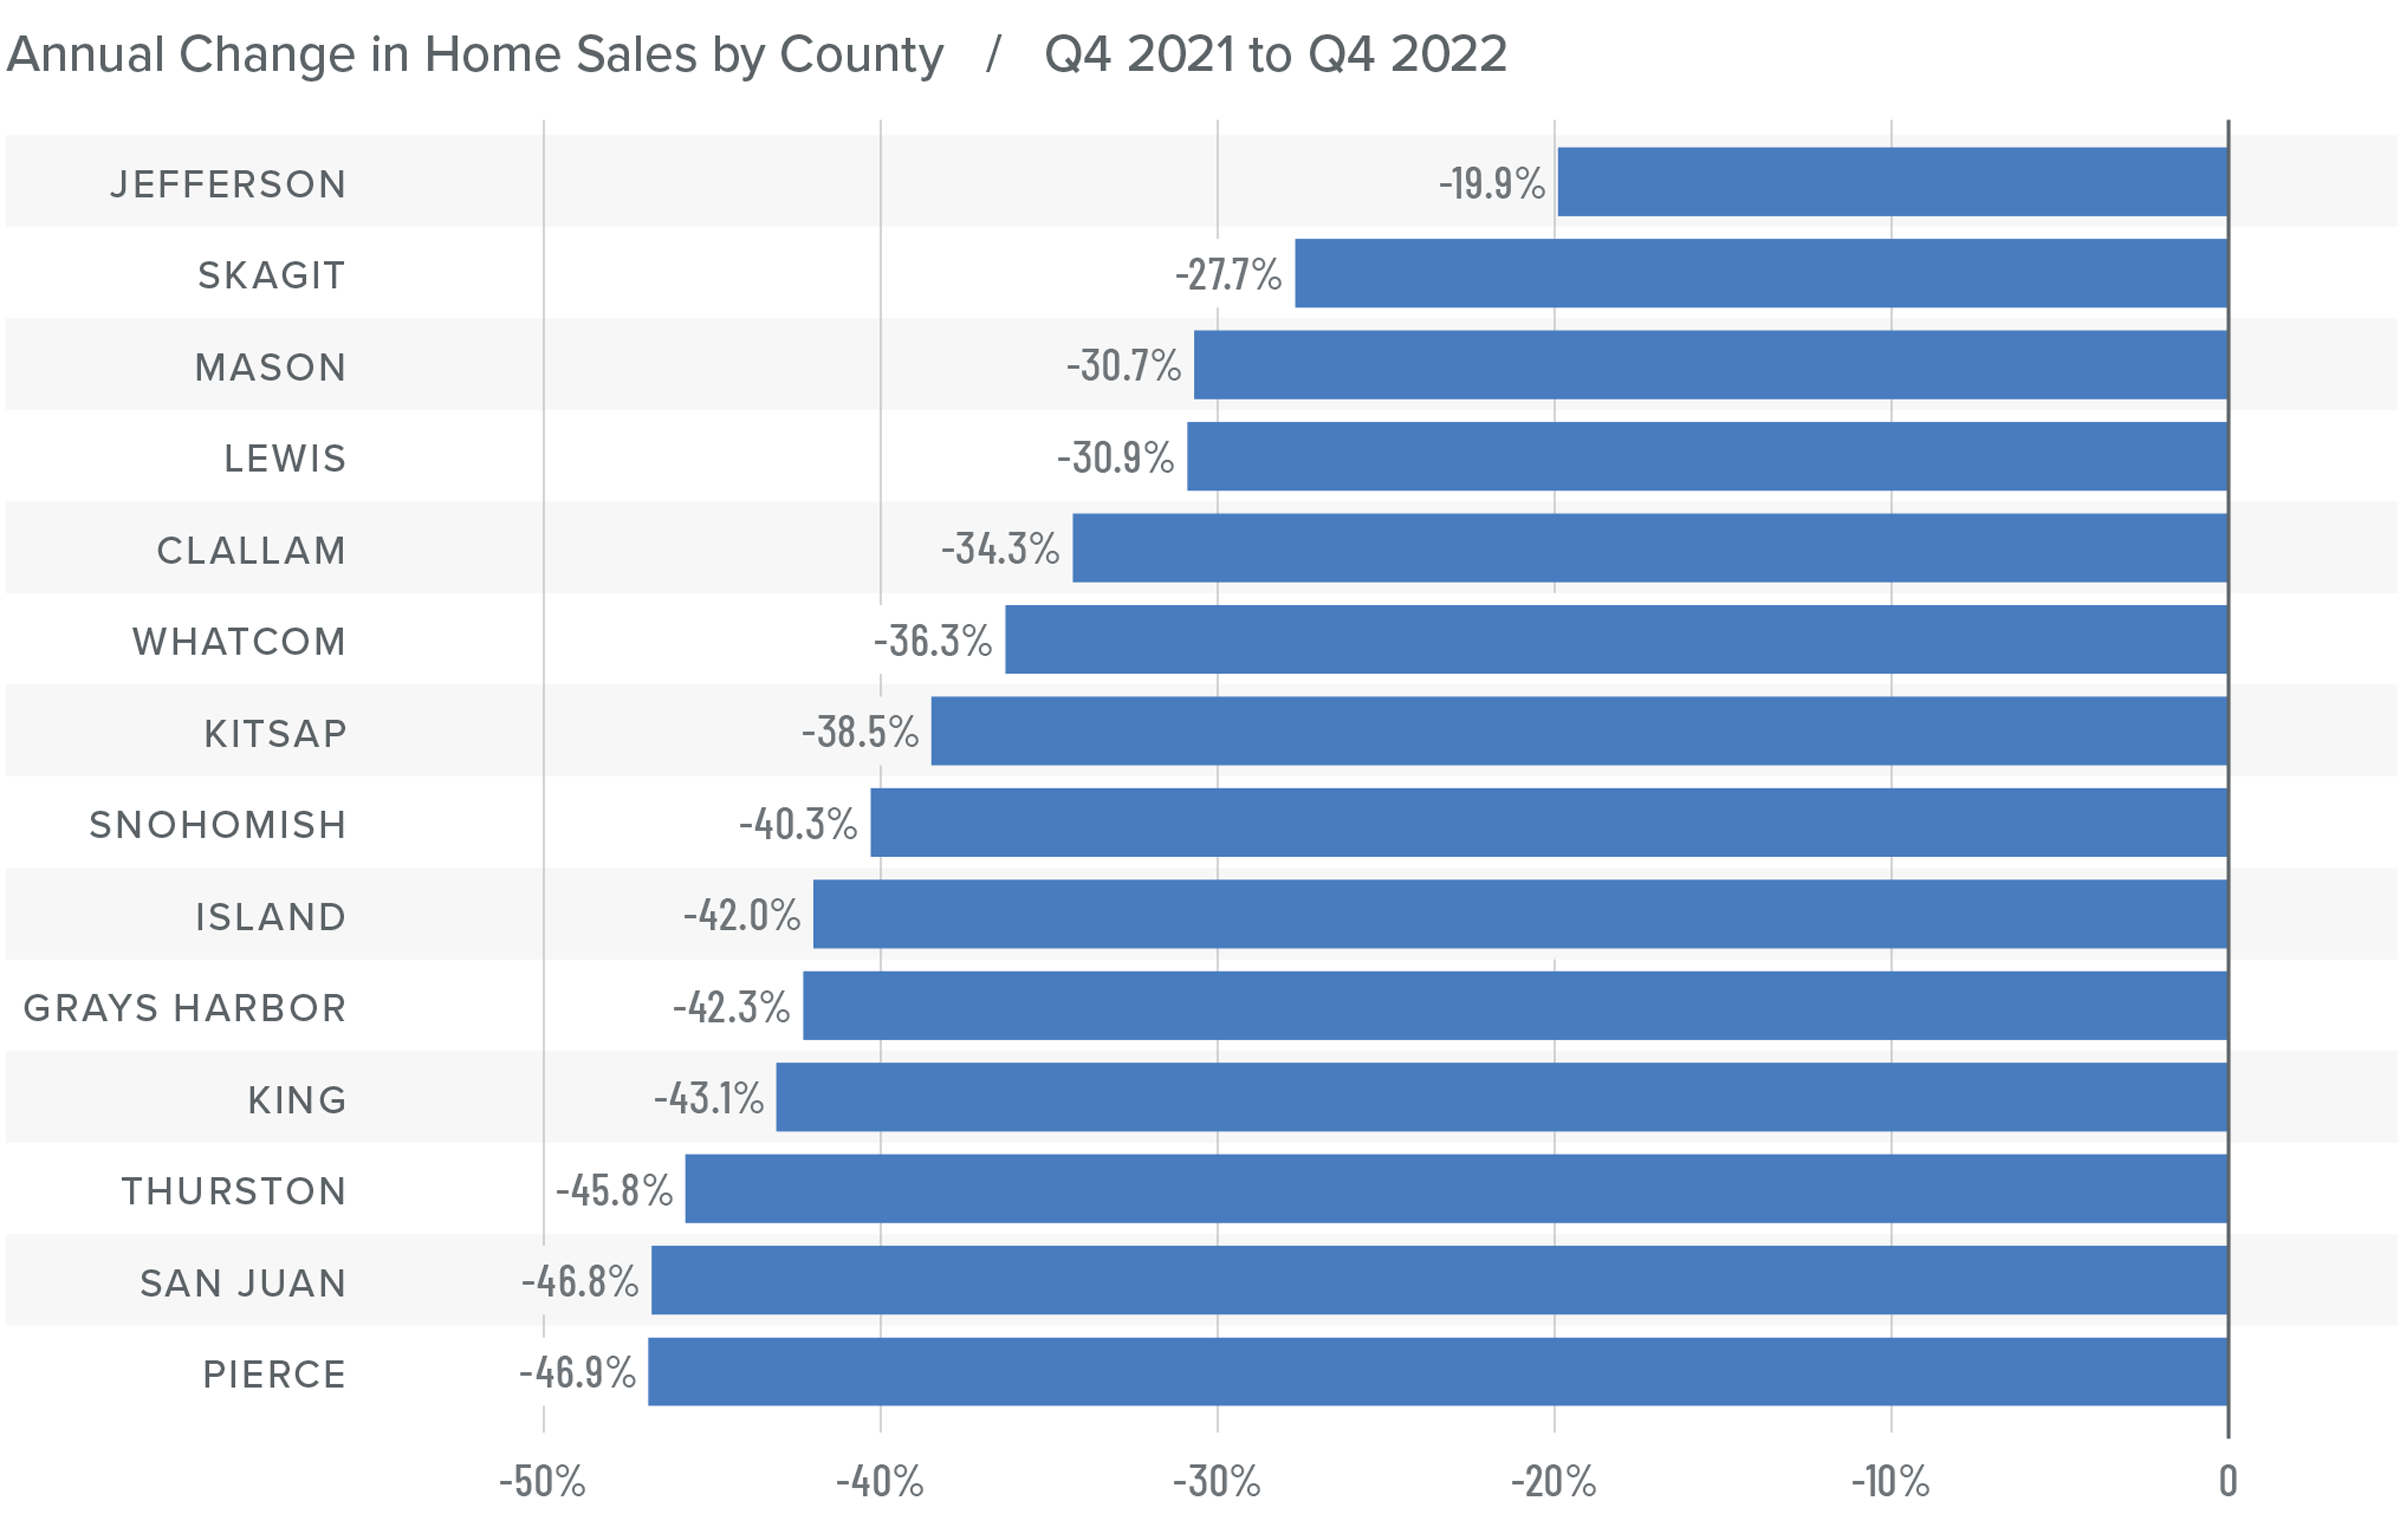
❱ In the final quarter of 2022, 12,711 homes sold, representing a drop of 42% from the same period in 2021. Sales were 34.7% lower than in the third quarter of 2022.
❱ Listing activity rose in every market year over year but fell more than 26% compared to the third quarter, which is expected given the time of year.
❱ Home sales fell across the board relative to the fourth quarter of 2021 and the third quarter of 2022.
❱ Pending sales (demand) outpaced listings (supply) by a factor of 1:2. This was down from 1:6 in the third quarter. That ratio has been trending lower for the past year, which suggests that buyers are being more cautious and may be waiting for mortgage rates to drop.
Western Washington Home Prices
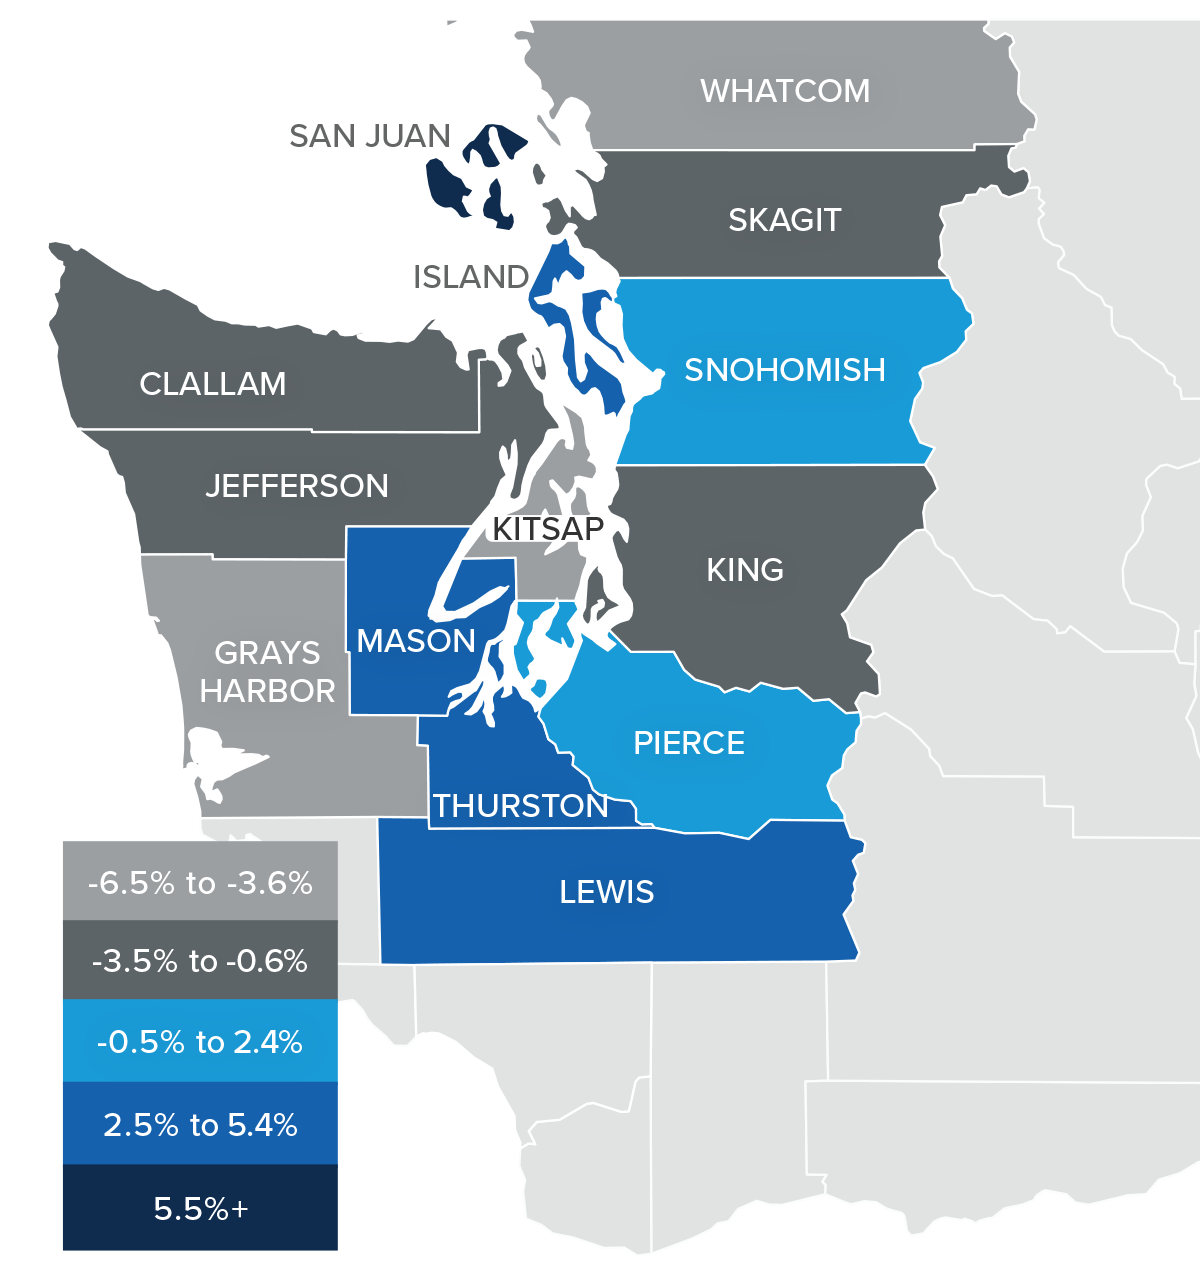
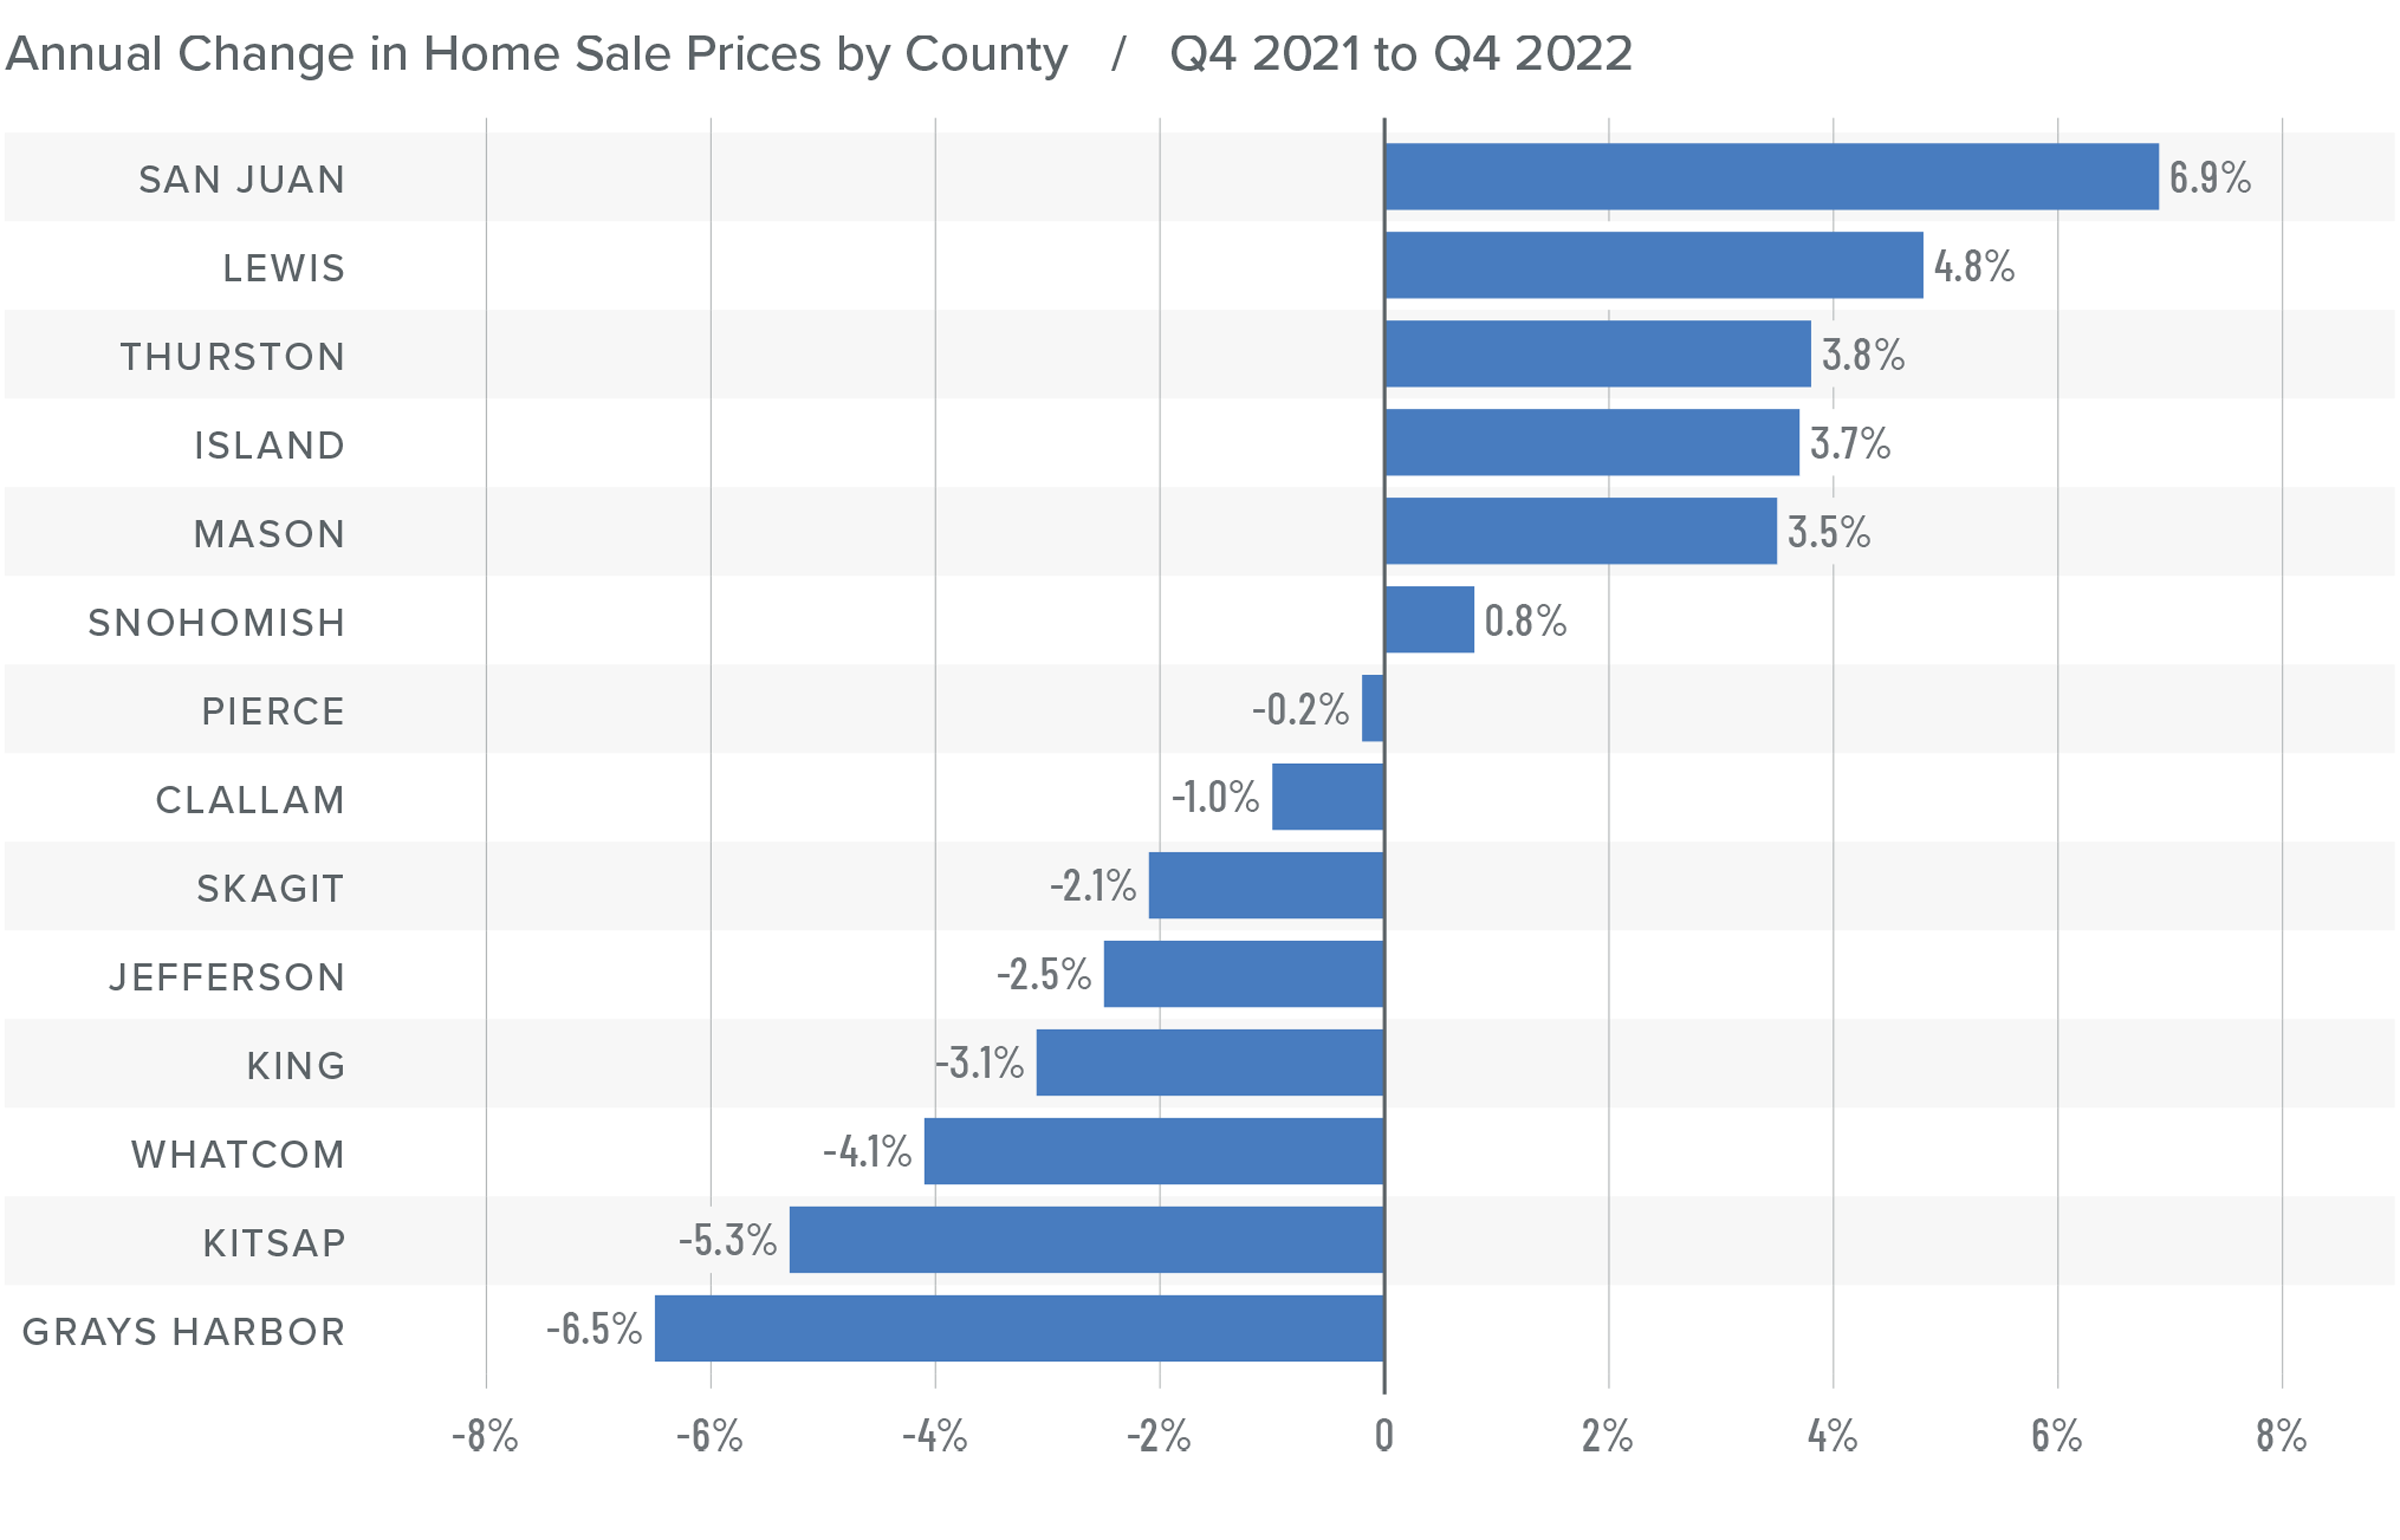
❱ Sale prices fell an average of 2% compared to the same period the year prior and were 6.1% lower than in the third quarter of 2022. The average sale price was $702,653.
❱ The median listing price in the fourth quarter of 2022 was 5% lower than in the third quarter. Only Skagit County experienced higher asking prices. Clearly, sellers are starting to be more realistic about the shift in the market.
❱ Even though the region saw aggregate prices fall, prices rose in six counties year over year.
❱ Much will be said about the drop in prices, but I am not overly concerned. Like most of the country, the Western Washington market went through a period of artificially low borrowing costs, which caused home values to soar. But now prices are trending back to more normalized levels, which I believe is a good thing.
Mortgage Rates
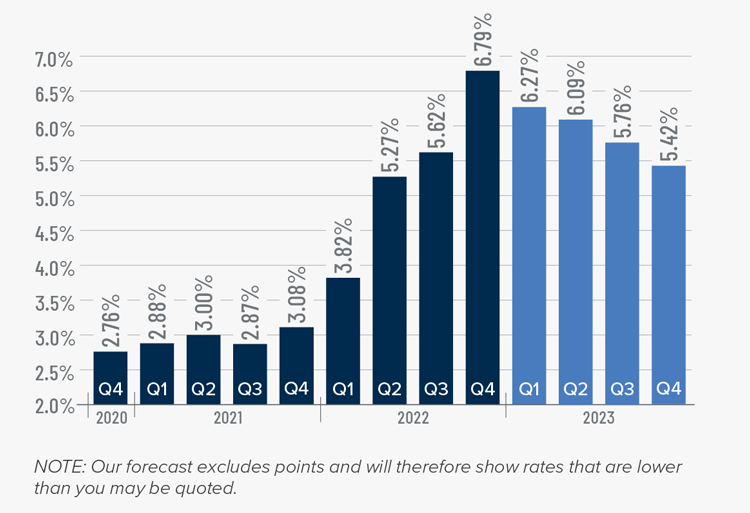
Rates rose dramatically in 2022, but I believe that they have now peaked. Mortgage rates are primarily based on the prices and yields of bonds, and while bonds take cues from several places, they are always impacted by inflation and the economy at large. If inflation continues to fall, as I expect it will, rates will continue to drop.
My current forecast is that mortgage rates will trend lower as we move through the year. While this may be good news for home buyers, rates will still be higher than they have become accustomed to. Even as the cost of borrowing falls, home prices in expensive markets such as Western Washington will probably fall a bit more to compensate for rates that will likely hold above 6% until early summer.
Western Washington Days on Market
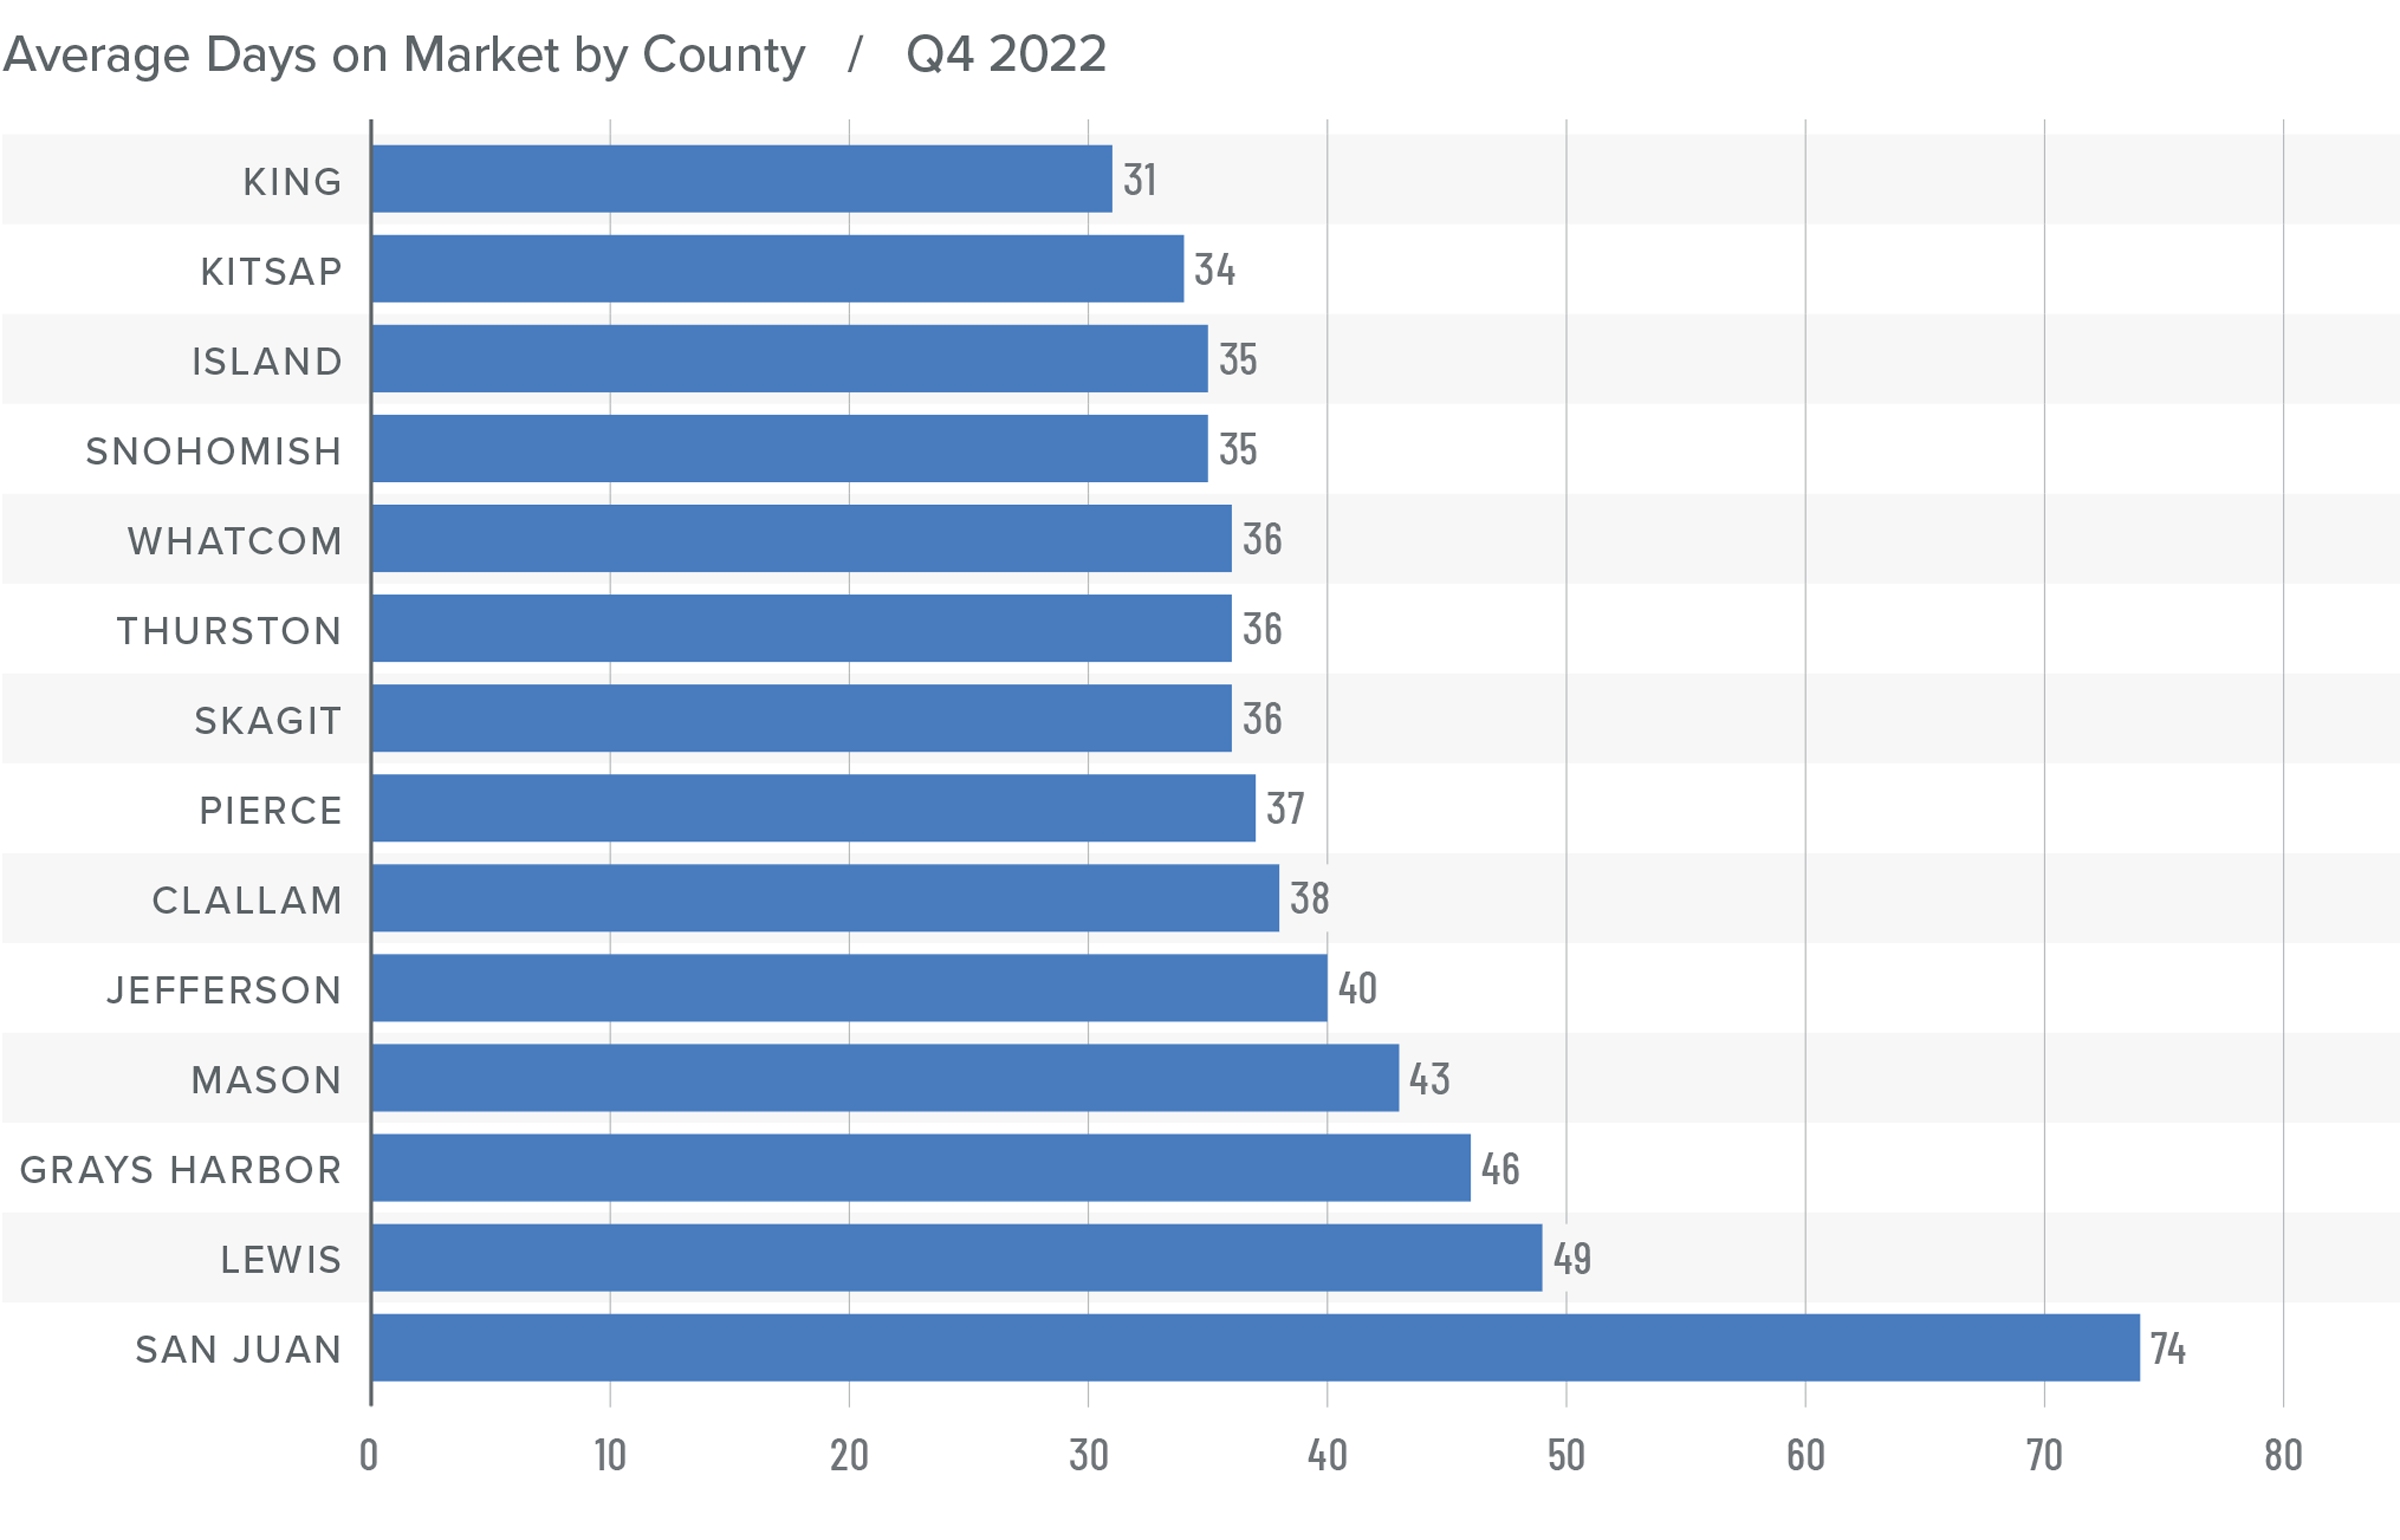
❱ It took an average of 41 days for homes to sell in the fourth quarter of 2022. This was 17 more days than in the same quarter of 2021, and 16 days more than in the third quarter of 2022.
❱ King County was again the tightest market in Western Washington, with homes taking an average of 31 days to find a buyer.
❱ All counties contained in this report saw the average time on market rise from the same period a year ago.
❱ Year over year, the greatest increase in market time was Snohomish County, where it took an average of 23 more days to find a buyer. Compared to the third quarter of 2022, San Juan County saw average market time rise the most (from 34 to 74 days).
Conclusions
This speedometer reflects the state of the region’s real estate market using housing inventory, price gains, home sales, interest rates, and larger economic factors.
The regional economy is still growing, but it is showing signs of slowing. Although this is not an immediate concern, if employees start to worry about job security, they may decide to wait before making the decision to buy or sell a home. As we move through the spring I believe the market will be fairly soft, but I would caution buyers who think conditions are completely shifting in their direction. Due to the large number of homeowners who have a mortgage at 3% or lower, I simply don’t believe the market will become oversupplied with inventory, which will keep home values from dropping too significantly.

Ultimately, however, the market will benefit buyers more than sellers, at least for the time being. As such, I have moved the needle as close to the balance line as we have seen in a very long time.
About Matthew Gardner

As Chief Economist for Windermere Real Estate, Matthew Gardner is responsible for analyzing and interpreting economic data and its impact on the real estate market on both a local and national level. Matthew has over 30 years of professional experience both in the U.S. and U.K.
In addition to his day-to-day responsibilities, Matthew sits on the Washington State Governors Council of Economic Advisors; chairs the Board of Trustees at the Washington Center for Real Estate Research at the University of Washington; and is an Advisory Board Member at the Runstad Center for Real Estate Studies at the University of Washington where he also lectures in real estate economics.
This article originally appeared on the Windermere blog January 26th, 2023. Written by: Matthew Gardner.

© Copyright 2023, Windermere Real Estate/Mercer Island.
How’s the Market? Annual Review of Seattle Area Real Estate

While 2022 began on the heels of an extreme seller’s market we saw in the wake of the COVID pandemic, the second half of the year showed a marked shift back toward normalcy. Rising interest rates and tech layoffs significantly slowed down the number of home sales. The good news for buyers is that we finally saw a rise in the number of homes for sale (although we’re still not back up to our pre-pandemic inventory level).
Our Chief Economist, Matthew Gardner, predicts that median home prices will continue to pull back from their 2022 spike, but will then resume a more normal level of appreciation once interest rates stabilize. You can find his full forecast here.
Click or scroll down to find your area report:
Seattle | Eastside | Mercer Island | Condos | Waterfront
SEATTLE
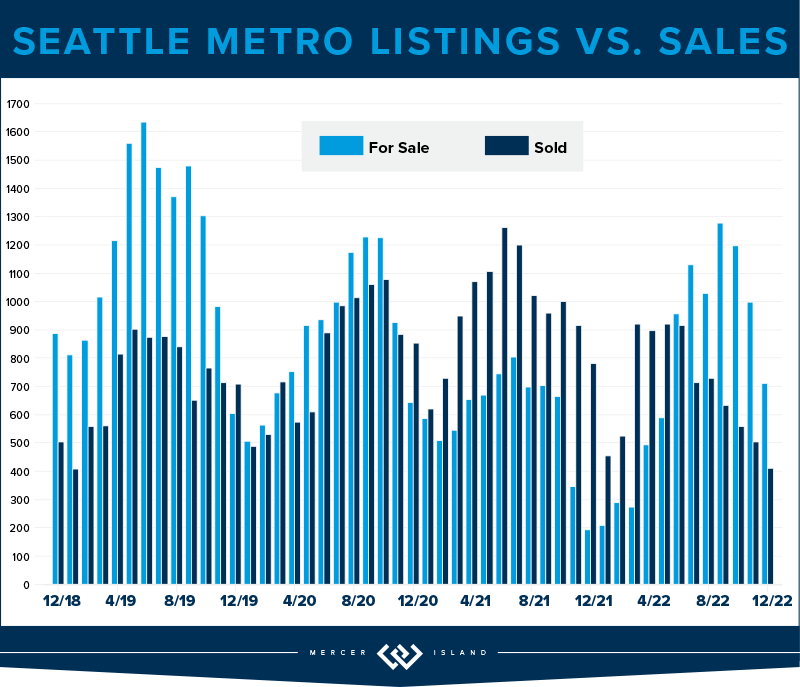
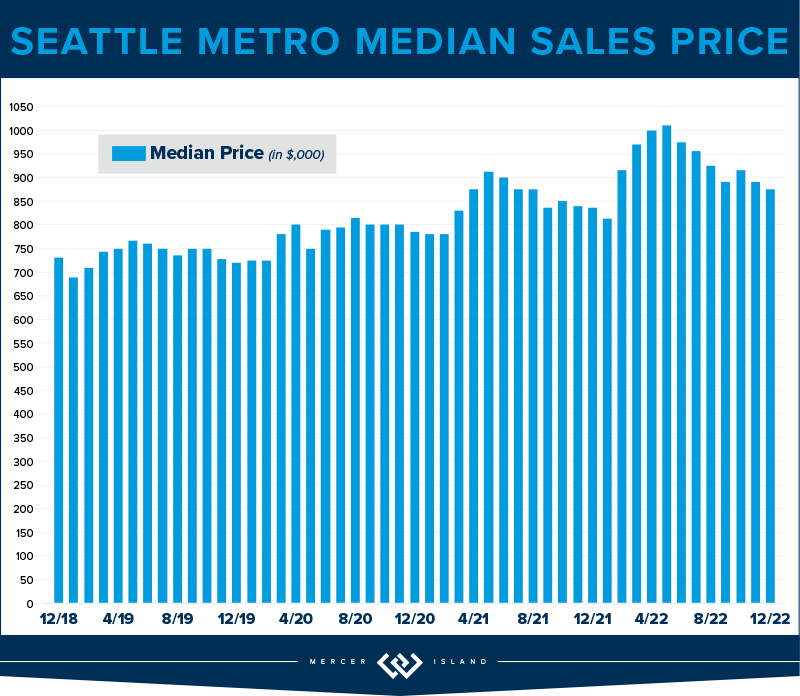
The Seattle real estate market seems to be out to prove the old “tortoise and the hare” fable. The tale the numbers are telling is that when you don’t boom big, you’re likely not to bust big. 2022 was a year of steady growth and a lot less fear than in surrounding cities.
On average in a 2022 total look back, Seattle’s median price was up 10% (to $940,000) over $852,000 in 2021. Most of this gain was realized in the first half of the year, and unfortunately eroded in the second half of the year—when combined, it paints a fairly clear picture that we’re back to a “normal” market coming into 2023.
Queen Anne-Magnolia (up 17%), West Seattle (up 14%) and the Central District (up 13%) all fared better than average. Kenmore hung in at a 6% gain, which, given the volatility of interest rates and speculation, is still a respectable number for the year!
The headline for this year is that overall transaction volume was down in a big way. In Seattle, there were a total of 8,173 homes that sold; this is down 30% from the 11,670 sales we saw the year before. The slower market is not, however, creating a climate of fear where homeowners jump to cash out at the peak. New listings for the year were down a total of 13%.
We’ll be watching closely in 2023. If consumer confidence builds with the stabilization of interest rates, we’re going to have an even larger inventory crisis than we’ve faced in years past.
Click here for the full report and neighborhood-by-neighborhood statistics!
EASTSIDE
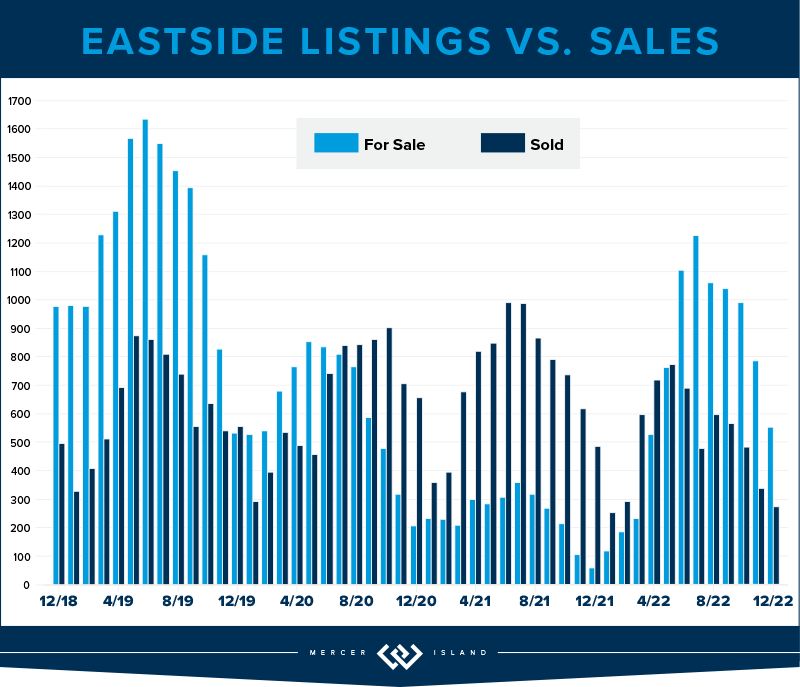
Finally, it’s safe to say that balance and normalcy have returned to the Eastside real estate market. The irony is: now that we’re in a balanced market, which is what homebuyers have purported to crave for a long time, the buyer’s appetite to purchase has all but dried up; overall transaction volume was down 36% in 2022 (5,448 sales vs. 8,569 in 2021).
If any of you are considering a move in the next 5 years, NOW is the time. The pendulum has swung back in the buyer’s favor: home inspections, negotiations and contingencies are all prevalent. We may not be at the exact “bottom” of pricing, but interest rates have stabilized, there are good homes for sale, and competition amongst buyers is rare. This is IT!
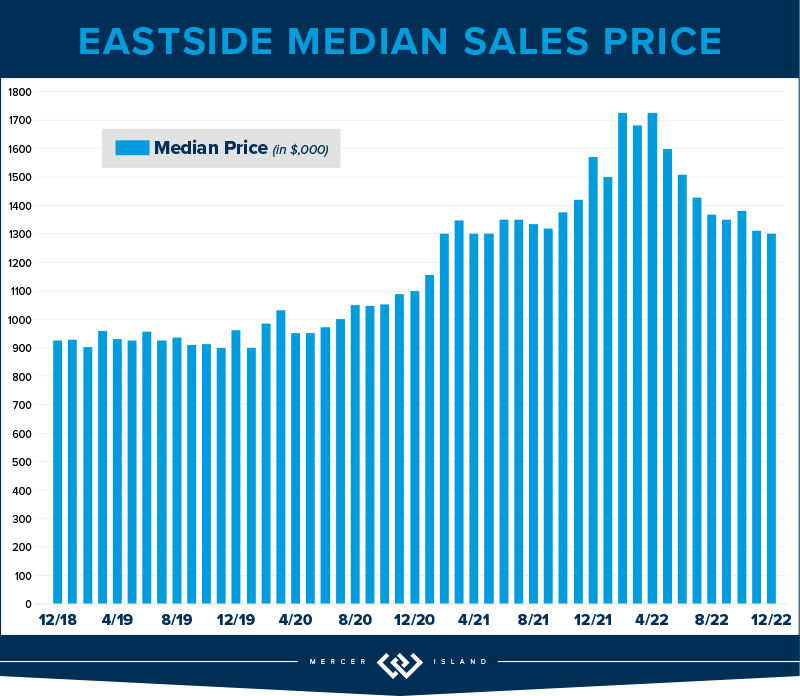
The Eastside’s Median Sale Price was $1,525,000 in 2022, up 14% over 2021’s unbelievable 30%+ gain ($1,350,000). Woodinville rules the day at a 17% rise, followed closely by Mercer Island (+16%) and Bellevue (both East and West at +15%).
While the market is slower paced, we are not in dire straits. This is thanks to a continued lack of inventory (down 5% YOY), and the amount of equity built in 2020 and 2021. Home sellers will spend the year working to determine the best way to attract a buyer. Price, preparation and timing will all play an important role. Home shoppers are sure to revel in their day in the sun!
Click here for the full report and neighborhood-by-neighborhood statistics!
MERCER ISLAND
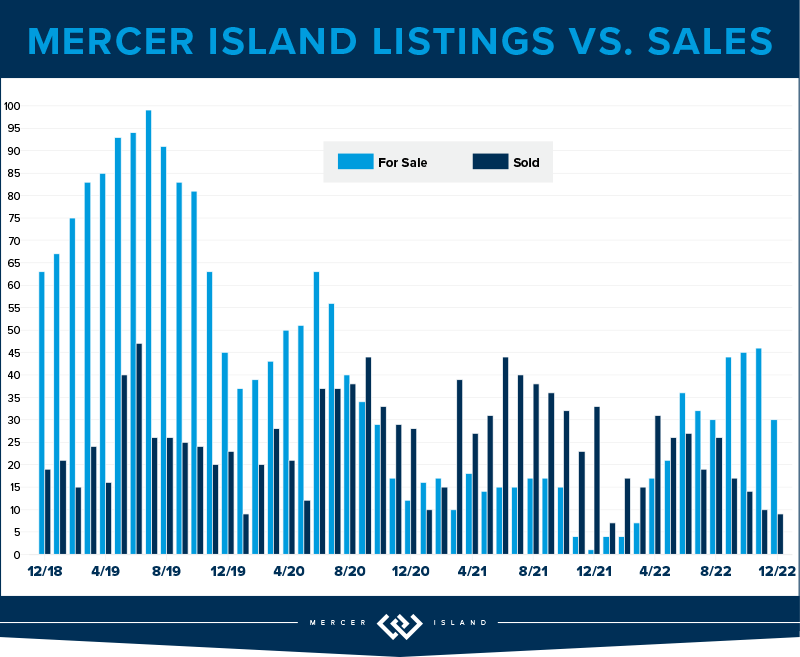
Mercer Island was once again its own unique micro-market within the Pacific Northwest. Total sales volume was only 209 homes, down 46% from 2021. This means that of nearly 10,000 households on the Island, only 2% purchased/sold a home.
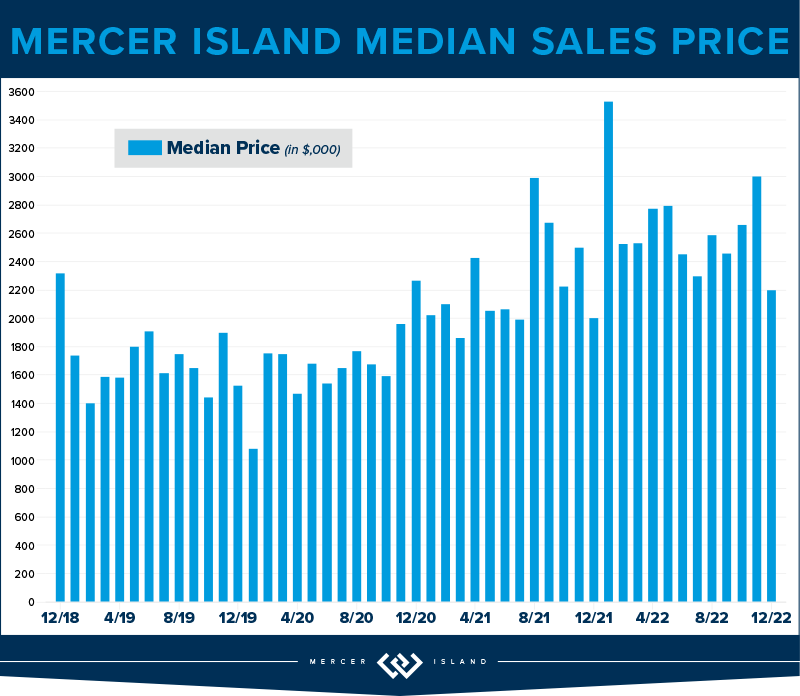
The pace of sales was affected not only by interest rate volatility but also by the local tech economy/job market. The median home price nevertheless held strong with a 16% rise over 2021, even with the price correction that we all started to feel mid-year.
Buyers have decided to sit on the sidelines while it all shakes out, but home-owners on Mercer Island are not running for the hills. They’re patiently waiting (often without adjusting their asking prices) for the demand to return. It seems to be working: the median list price to median sales price ratio ROSE in 2022 from 77% to 88%.
2023 should be a solid year for Mercer Island real estate. All the pieces are in place: community pride, great schools and easy transportation. Let’s see if the upward trend continues!
Click here for the full report and neighborhood-by-neighborhood statistics!
CONDOS – SEATTLE & EASTSIDE
Seattle condos saw a Median Sale Price increase of 6% (to $520,000) and Eastside condos saw a 13% increase (to $620,000) in 2022. 53% of Seattle condos and 67% of Eastside condos sold in the first ten days on the market. This growth is larger than what we saw in 2021, which hopefully is some good news to anyone thinking of selling a condo in 2023. It seems that demand for urban living may be returning.
66% of Seattle condos and 77% of Eastside condos sold at or above their listed price. Those listings that sold in the first 10 days on the market went for an average of 1% and 4% above their list price, respectively..
On the Seattle side, Shoreline and Lake Forest Park condos saw about a 20% increase—and on the Eastside, Sammamish and East Bellevue condos carried the day with 19% and 23% increases—in Median Sale Price.
Overall, condos get our award for “ones to watch.” They remain a bright spot in terms of affordability when compared to single family homes, especially on the Eastside. Compare the $620,000 median sale price of a condo to the $1,525,000 median home price and it’s clear condos are a great first rung of the property ladder that might get attention in 2023.
Check out area-by-area details the full condo report.
WATERFRONT
There were 93 privately-owned waterfront home sales in the greater Seattle-Eastside region in 2022 (Eastside-32; Seattle-36; Lake Sammamish-15; Mercer Island-10). This is down significantly from the banner year in 2021 when we saw a whopping 170 total sales.
This truly is a market with geographic limitations. With such a high volume of sales in 2021 and a relatively strong 2022, we expect 2023 to be more conservative. Our late-2022 market shift from an extreme seller’s market to a more balanced level of supply and demand coincided with the close of the waterfront selling season. This means pricing will be tricky this season as we explore uncharted waters. More than ever, real estate experts will be essential to analyze the data and consult their spidey-senses to find the price that will attract a buyer in this new normal.
This brief overview of the entire Seattle-Eastside private waterfront market, including Mercer Island and Lake Sammamish, illustrates the trends occurring in our region over time. This data is interesting and insightful but cannot replace an in-depth waterfront analysis with your trusted professional.

© Copyright 2023, Windermere Real Estate/Mercer Island. Information and statistics derived from Northwest Multiple Listing Service and Trendgraphix, and deemed accurate but not guaranteed.
 Facebook
 X
X
 Pinterest
 Copy Link
